The Gist: Episode 2 A New Chart
I had a fever, and the only cure was More Chart! This is a Bonus Gist.

Hello all!
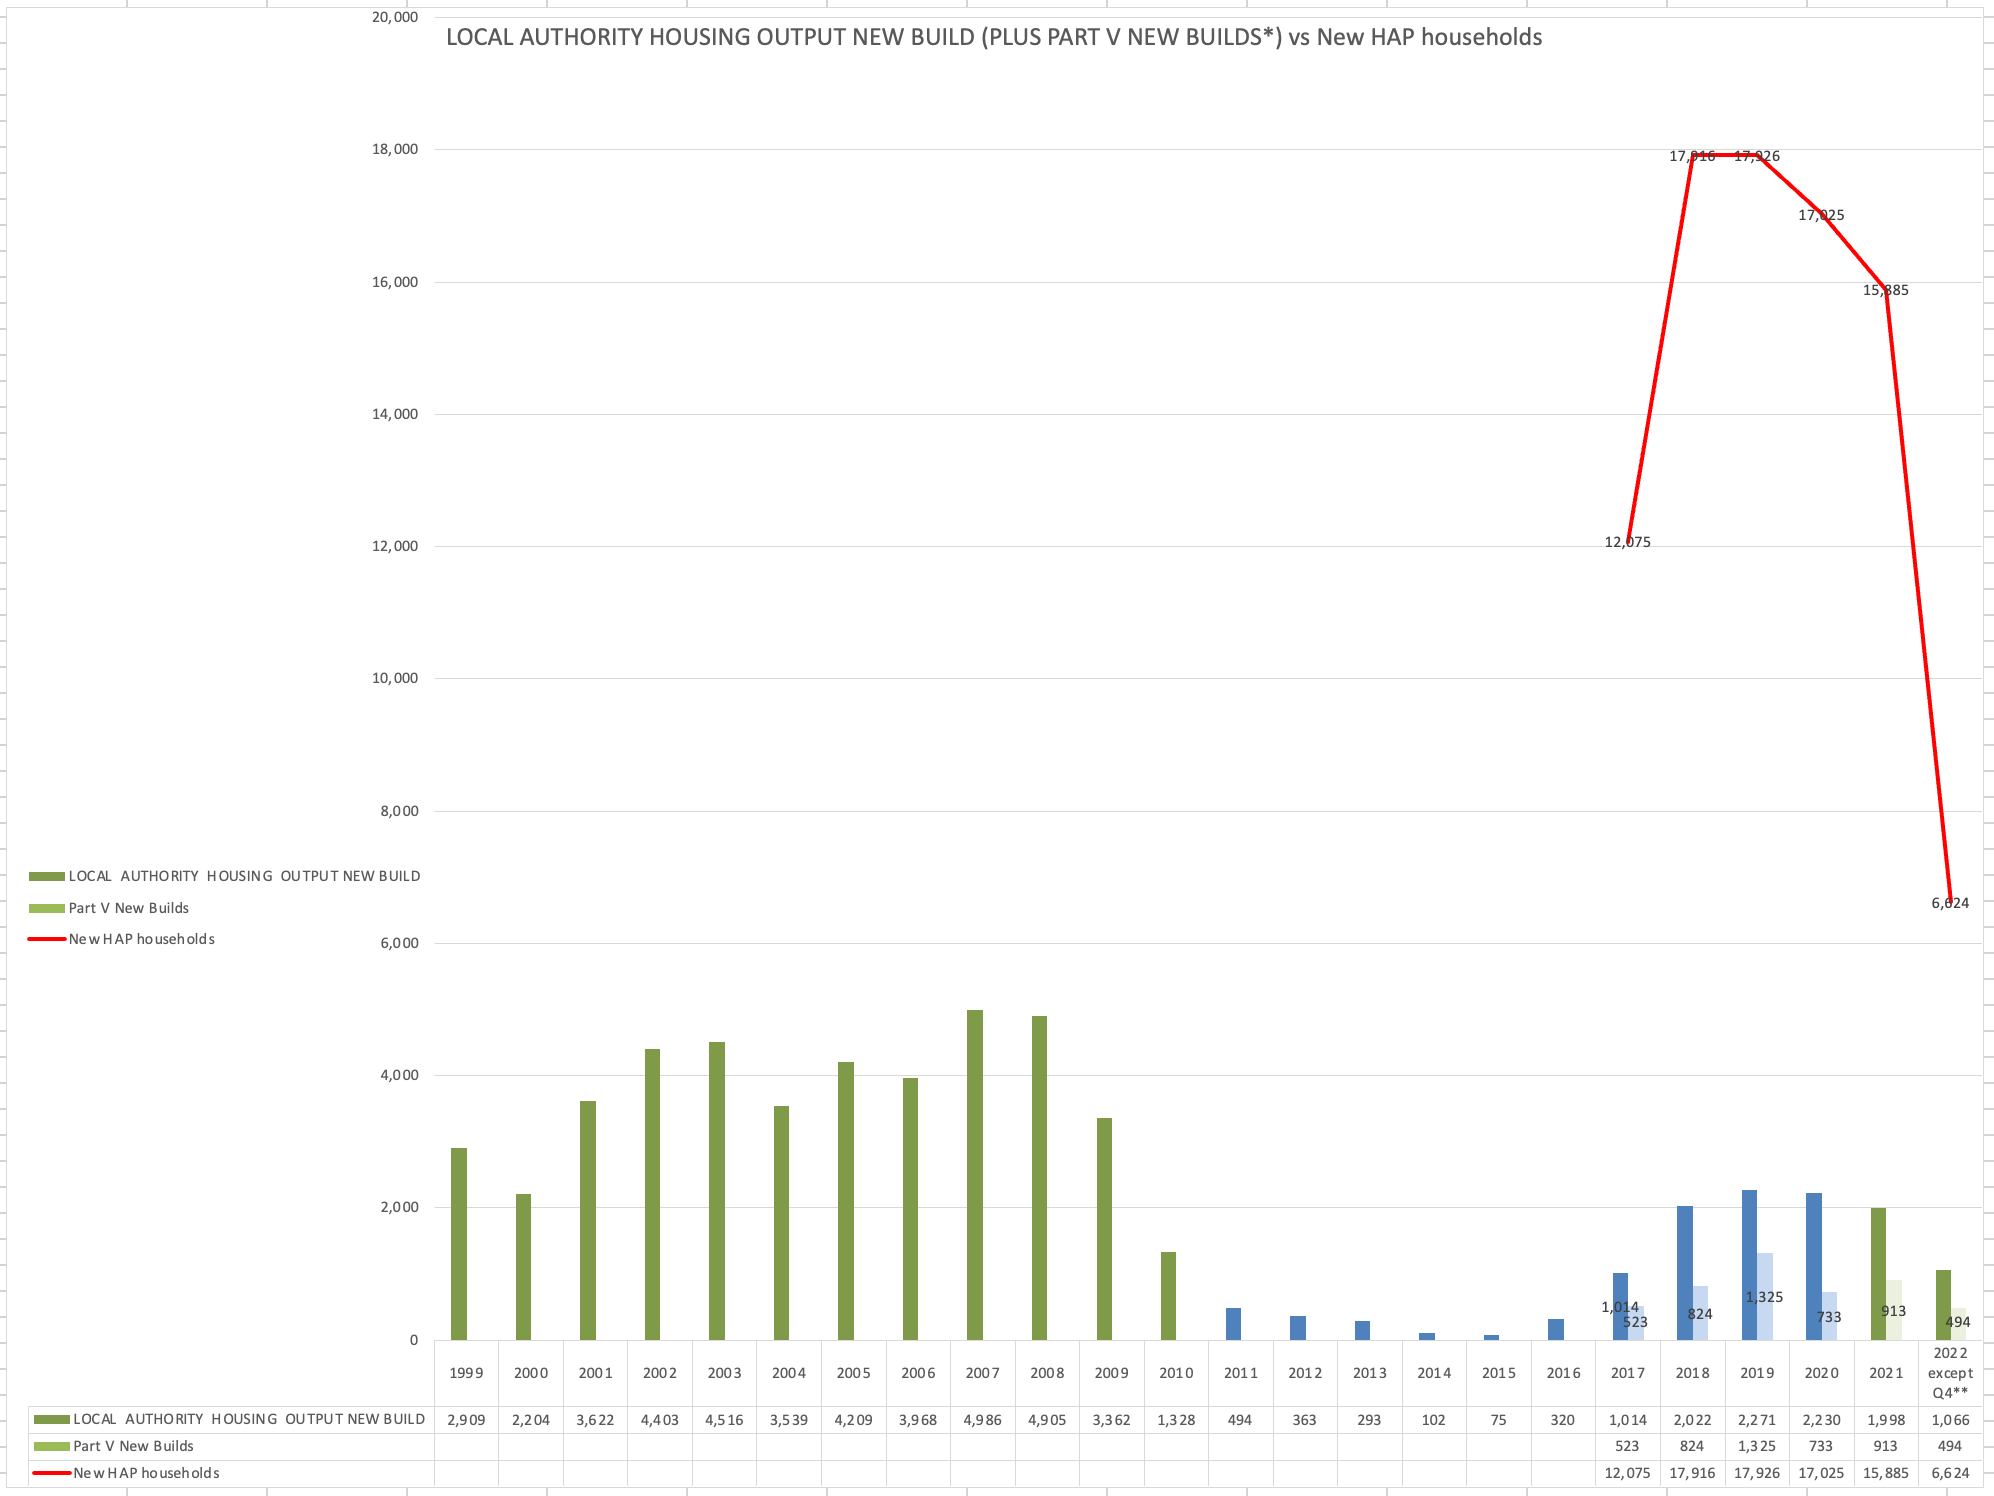
The chart from the Weekend's Gist (Where did the houses go?) prompted some questions about other numbers to show.
I think some of the points were valid. Though I was working from the Goverment's own datasets, the spreadsheet for Local Authority New Builds starts to break out Part V new builds (ie, those built by developers but then given to the Local Authority) after 2016. I've now added those in too.
I have also, for illustration, added in the figures for the numbers of new households being supported by HAP payments to private landlords each year since 2016. I think it's an eyecatching multiple of the state's new housing output.
Hapless Records
Just a point on the HAP numbers. The state's own statistics sources disagree when it comes to figures for new HAP households. One report (which I have used above as they are from the same set of stats as the Part V data) delivers one set of numbers. But the HAP quarterly stats deliver similar but not identical figures. As Social Justice Ireland have said "If Government is to address policy failures on housing, it must do so on the basis of real data".